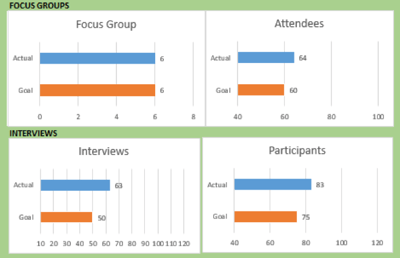
 It is helpful to have a visual representation of your activity and progress with respect to your community engagement strategy. This is a simple dashboard tool that has been set up to allow you to track your goals and your activity over a 12-month period (by month) and then see bar charts auto populate so you can see progress.
This spreadsheet will track goals, activity, and actual achievement for focus groups, townhalls, interviews, and surveys, as well as track metrics for Facebook and Twitter.
The tool is meant to help you get started. If you have basic Excel Skills you should be able to add other things to tracks.
Please read the instructions and play with the spread sheet to see how it works.
Download the Dashboard file here. Let me know how it goes and if you end up adding to it, please share it with me at mark@tamarackcommunity.ca.


